About Mexico Toy Company
Sales & Inventory data for a fictitious chain of toy stores in Mexico called Maven Toys, including information about products, stores, daily transactions, and current inventory levels at each location.
Project Overview
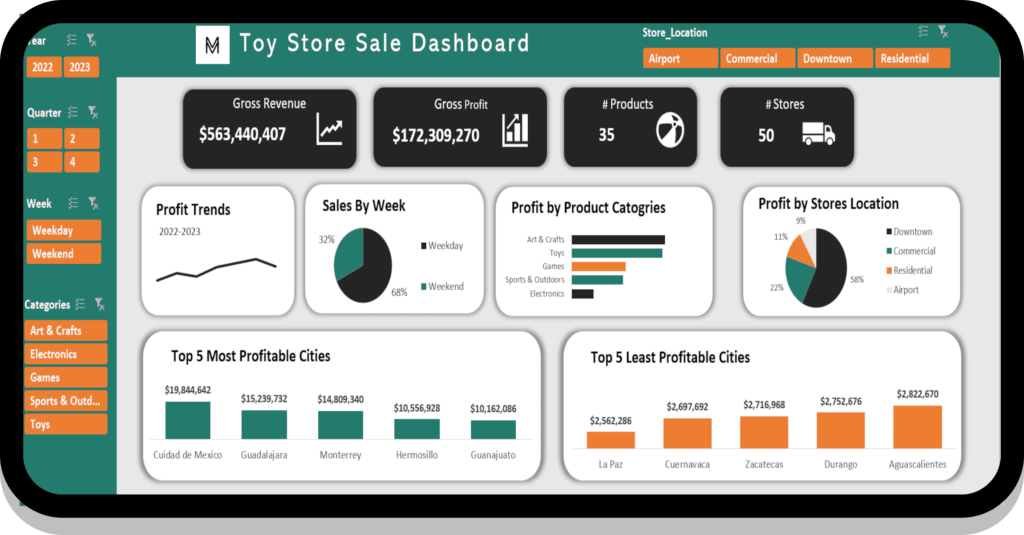
The company wants a sales dashboard having all the necessary metrics needed for them.
They also need us to know about-
- Seasonal trends in the sales day.
- Most Profitable Store Locations
- Most Profitable Product Categories across store locations.
- Top 5 Most and Least Profitable Cities
Software Used
Excel
Tools Used
Power Query, Data Model, Power Pivot
Dashboard Overview
The dashboard contains important metrics that are required for sales.
For deeper analysis, the dashboard can be filtered by years, quarters, weeks, product categories, and store location.
Insights
- Sales drop in Q3 2021 by 9.13% and 13.81% in 2022
- Downtown holds the most profitable store locations
- Arts and Crafts and Toys are the two most profitable Product Categories.
- Companies do more than half of their sales on weekdays.

