About Project
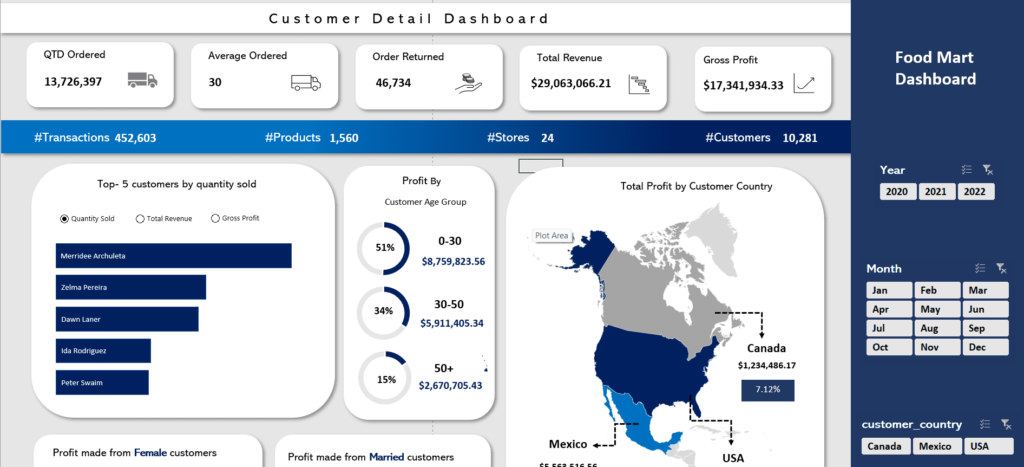
Virtue is a popular company that has many food marts in USA, Mexico and Canada. The company needs to know about its customers and profit margins. For that company demanded to make a dynamic dashboard that helps in analyzing the important metrics for them.
Metrics
The company wants to know about several listed things in the dashboard-
- Total Revenue and Gross Profit
- Total orders sold and orders returned
- Top Customers
- Top Profitable Cities by Countries
- Comparison of profits by gender and also by marital status
Software Used
Ms Excel
Skill Learned
Power Query, data cleaning and processing, data modeling, power pivots, and pivot charts
Dashboard Overview
The dashboard comprises all the metrics listed above and also contains additional metrics such as the number of transactions, stores, products, etc
The dashboard is fully dynamic. We can use filters(such as date filter or year filter) to get useful insights. Also, there is a place filter to get to know about the information by places.
Insights
- Most of the company profit is made from male customers.
- Most of the company’s profit is made from unmarried customers.
- Company should focus on targeting young customers of age group 0-30

